Compensation Benchmarking Methods for Nearshore Engineering Roles
Fully loaded cost models reveal the true savings—and true risks—of nearshore engineering hiring.

Compensation benchmarking for nearshore engineering roles breaks down at the starting line: most founders and hiring managers compare a US employee's base salary against a nearshore contractor's hourly rate, two numbers that measure fundamentally different things. One is a partial figure that excludes benefits, taxes, and overhead; the other is a blended rate that already includes agency markup and, often, compliance costs the US number never accounts for. Getting a benchmark that actually holds up requires building a fully loaded cost model on both sides before any comparison means anything.
The stakes are real money, not academic precision. Benefits alone make up 29.9% of total compensation in private industry, according to a federal labor statistics agency's Employer Costs for Employee Compensation release, and this figure is absent from the base-salary line item that ROI calculators cite. The BLS Occupational Outlook Handbook puts median US software developer pay at $133,080 a year, and that number gets passed around constantly, but it's a pre-burden figure. Stripping out the benefits, payroll taxes, recruiting cost, and ramp time reveals that a benchmark built on that number alone either overstates how much nearshore hiring saves or understates what the US hire actually costs. Both errors distort the hiring decision, just in opposite directions.
Building the fully loaded US cost baseline
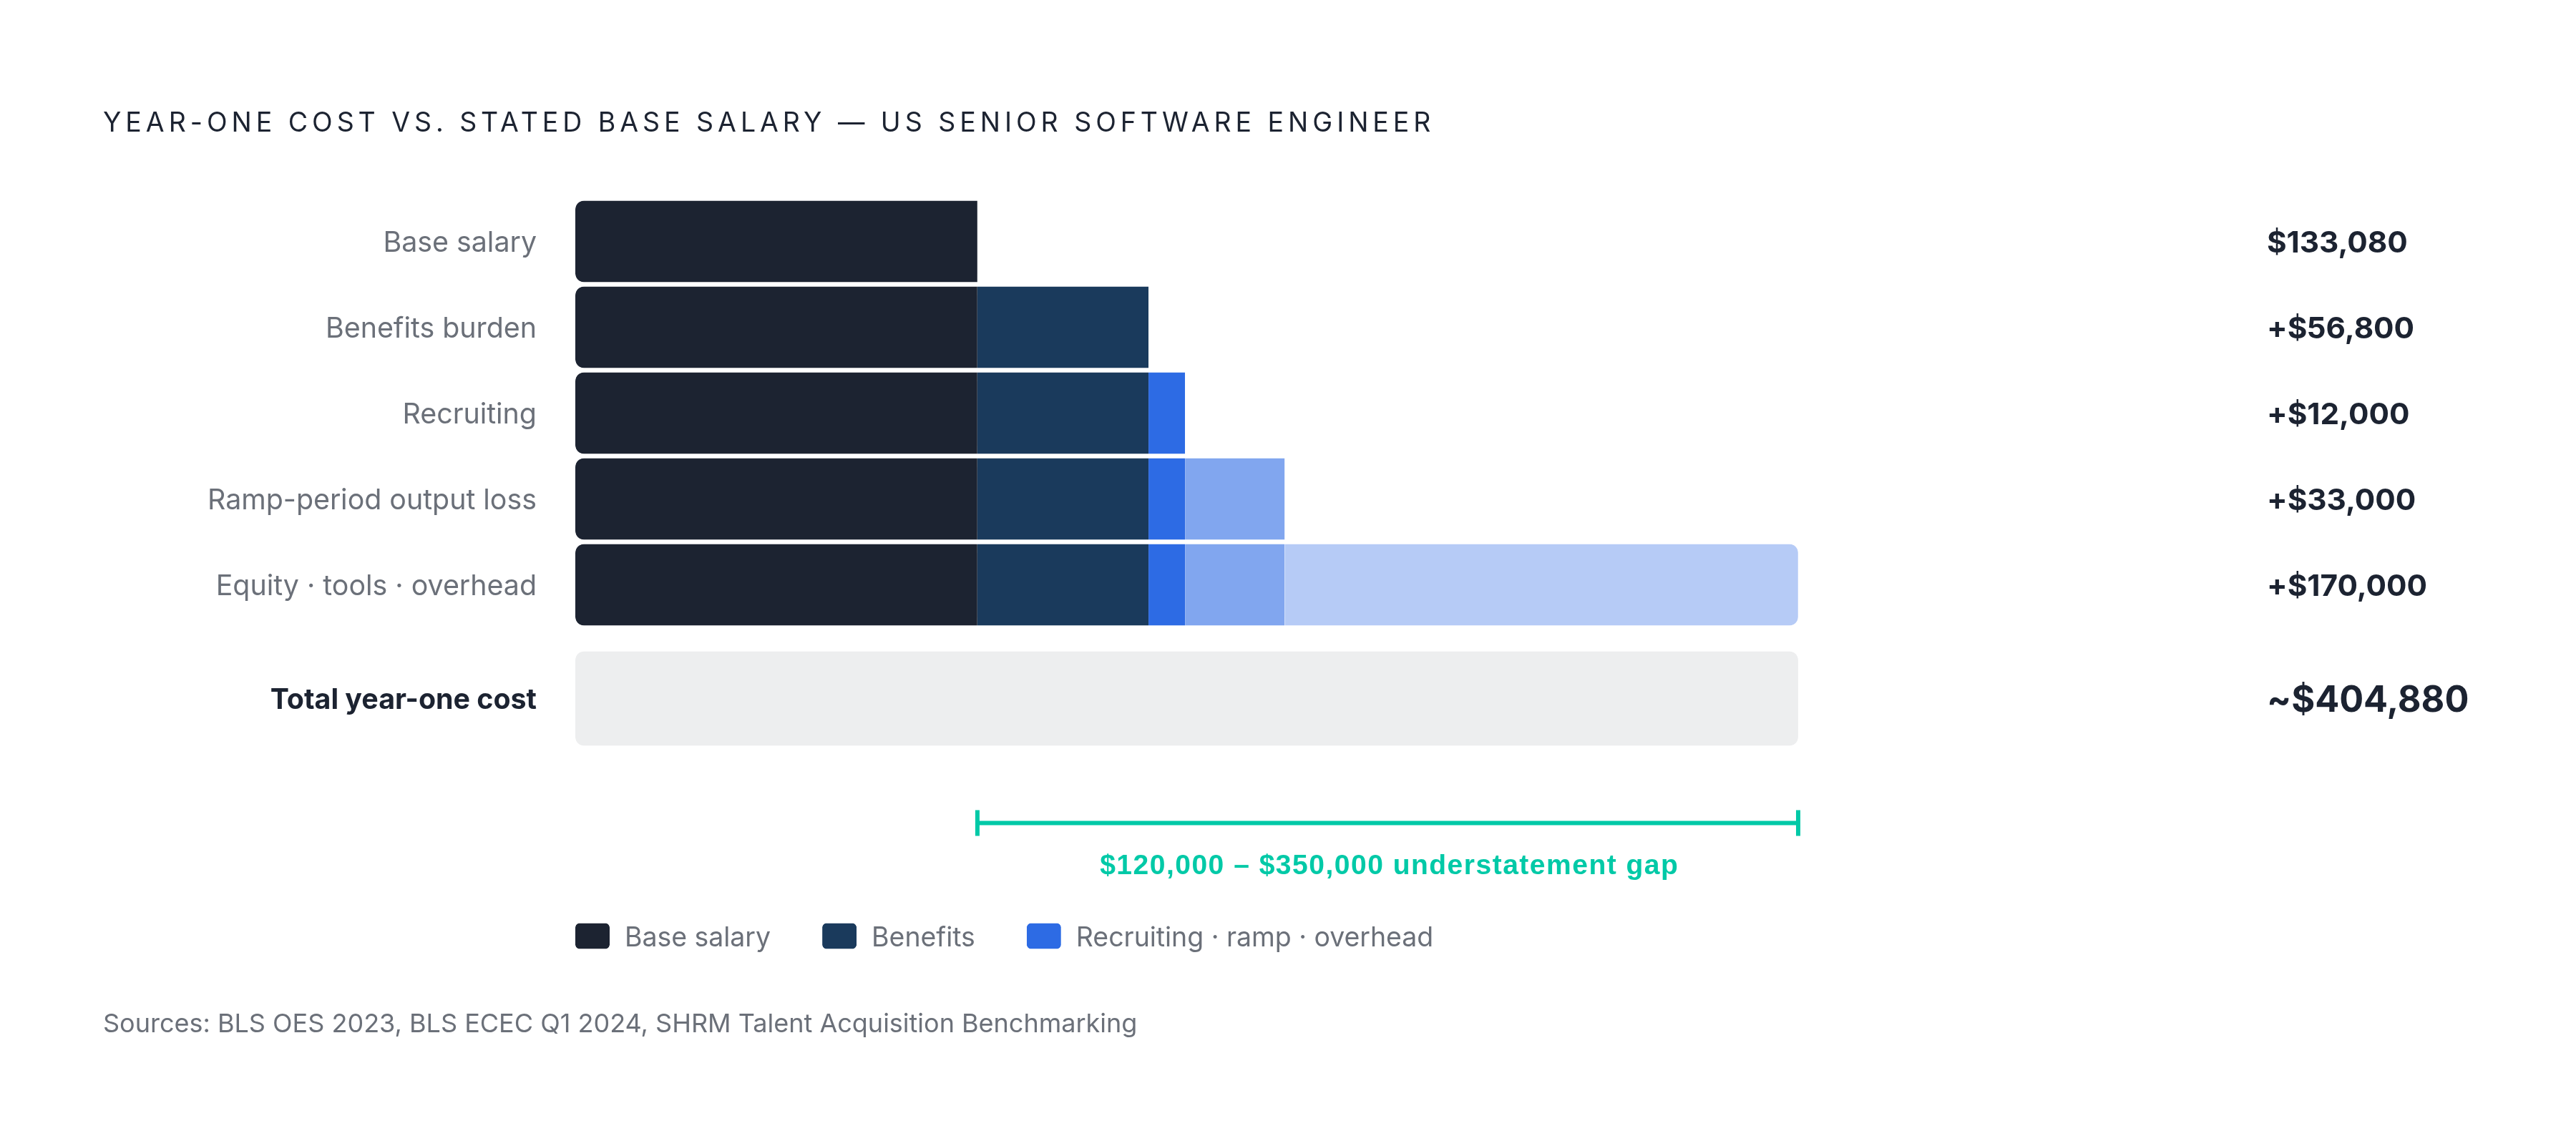
Start with salary, but treat the BLS median as a floor, not a ceiling. Venture-backed and growth-stage companies routinely pay above it, particularly for senior engineering roles where competition for talent is tightest. The Blue Signal Search 2026 Salary Guide, pulling from BLS, Salary.com, Payscale, and Glassdoor, puts national base salary ranges at $118,000 to $179,000 for senior software engineers, $98,000 to $162,000 for full-stack engineers, $102,000 to $160,000 for DevOps engineers, $110,000 to $170,000 for cloud engineers, $100,000 to $158,000 for backend engineers, $92,000 to $150,000 for frontend engineers, and $70,000 to $112,000 for QA engineers.
Now apply the benefits multiplier. At 29.9% of total compensation, benefits add a fixed load on top of every one of those figures, covering health insurance, paid leave, retirement contributions, and legally required benefits that don't show up anywhere on an offer letter's headline number.
Recruiting cost comes next, and it's not trivial. SHRM's benchmarking puts average cost-per-hire at $5,475 for non-executive roles, and for senior engineers the real number climbs well past that average because the interview loop runs longer and time-to-fill stretches out. Add ramp time as its own line item: new hires working in complex codebases or regulated environments deliver partial output for the first 30 to 90 days on the job. That's not full capacity from day one, it's deferred output, and a cost model that ignores it is quietly lying to whoever reads it.
Round out the model with equity grants, equipment, tooling licenses, workspace costs where they apply, and the management overhead that comes from senior staff sitting in interview loops and onboarding sessions. Once equity grants, equipment, tooling licenses, workspace costs where they apply, and the management overhead from senior staff sitting in interview loops and onboarding sessions are added, a salary that looked like one clean number on a job posting turns into something materially larger. Research from stealthagents.com, citing Korn Ferry and Robert Half, found that most first-year cost models anchored only to base salary understate actual year-one cost by $120,000 to $350,000, depending on company stage and how the recruiting process was run. That's not a rounding error. A hiring decision made on real numbers produces a different outcome than one made on a fiction, given that gap of $120,000 to $350,000.
VP of Engineering: the US baseline for leadership roles
VP of Engineering hires make the base-salary error impossible to ignore, because every cost category that gets glossed over at the individual-contributor level gets amplified here. High base pay, executive search fees, meaningful equity, and a ramp period that can run several months all stack on top of each other.
Base salary benchmarks shift heavily by company stage. Base salaries scale sharply with company stage and vary across published 2026 compensation sources, with early-stage startups anchoring toward the lower end of the spectrum and public or large-cap firms reaching $290,000 to $450,000 or more at the top. The Blue Signal Search 2026 Salary Guide puts the national median at $225,000, with a range of $175,000 to $275,000.
None of that is the real number, though. Salary makes up only 55 to 65% of year-one cost for a VP of Engineering hire. The rest comes from retained search fees, which run 25 to 30% of total cash compensation according to Heidrick & Struggles and Korn Ferry, plus equity grants, benefits overhead, and ramp cost. Time-to-fill for this role is meaningfully longer than for individual-contributor searches, and every one of those days carries a real vacancy cost that a serious model has to include. Get the hire wrong, and the cost compounds: full turnover cost for a VP of Engineering is widely cited as a multiple of annual salary once replacement, retraining, and lost momentum are modeled. The methodology that applies at this level, fully loaded, adjusted for company stage, inclusive of search fees and ramp, is the same methodology that should apply to every engineering hire below it. Leadership roles just make the stakes of skipping that methodology obvious.
Building the fully loaded nearshore cost baseline
The nearshore side has its own version of the base-salary mistake: treating a raw hourly contractor rate as the whole story, when statutory employer obligations, agency markup, compliance infrastructure, and integration cost are all unpriced additions to that rate.
Billing rates give a starting point. The altLINE 2026 markup guide puts junior and support roles at $25 to $35 an hour, mid-level roles at $40 to $60 an hour, and senior specialists at $70 to $90 an hour. Senior LATAM engineers specifically run $60 to $74 an hour, against $150 to $180 or more an hour for a comparable US hire, according to Kore BPO. That gap looks enormous until the rest of the model gets built out.
Agency markup eats into it first. Nearshore staffing agency markups average 35 to 41%, with a documented range of 25 to 71% depending on skill level and contract length, IBISWorld (2026) reports, and base pay represents a meaningful share of the billed rate, with the remainder covering markup and overhead. Then come the statutory employer costs, which vary by country and have to be modeled explicitly rather than buried inside a blended number. Mexico and Colombia both require aguinaldo, or 13th-month pay, which adds a measurable load to annual compensation cost on its own. Brazil's CLT employment framework adds a substantially higher employer burden than either Argentina or Colombia at comparable base salaries. Chile's 2025 pension reform will gradually raise mandatory employer contributions by a total of 7%, reaching 8.5% including the existing 1.5% SIS contribution by 2033, with the increase starting at 1% as of August 2025 and rising incrementally each year afterward.
For companies hiring full-time nearshore employees rather than contractors, an Employer of Record model handles payroll, benefits administration, and local legal compliance, and that fee has to sit in the cost model as its own line, not get absorbed into a rate that looks artificially low. Integration cost is the variable that's easiest to skip and most expensive to ignore: timezone overlap, communication bandwidth, and whether a team is treated as embedded or outsourced all shape how much output actually comes back per dollar spent. A lower rate that produces slower cycles or more rework isn't cheaper once the full cost of ownership gets tallied. For a US-market reference point, Salary.com data puts average annual pay for Nearshore Code employees in the US at $109,878 (range $96,822 to $123,963), an hourly equivalent of roughly $53.
LATAM salary benchmarks by country, seniority, and specialization
Seniority drives cost more than geography does in 2026. A senior engineer in Mexico and a senior engineer in Argentina cost close to the same amount, and picking a country purely to chase savings at a fixed seniority level produces smaller gains than most rate cards suggest.
Howdy's payroll dataset, covering more than 12,500 professionals across LATAM (2025-2026), puts the regional average take-home around $57,000 a year, with senior developers landing in the $65,000 to $75,000 range and staff or principal engineers able to clear $90,000. Country by country, the picture varies more by specialization and English proficiency than by cost of living alone.
Argentina posts the highest average salaries in the region for mid-to-senior roles, the same Howdy data shows, and ranks as the strongest English-proficiency market in Latin America, which commands a premium on top of engineering depth. Mexico offers strong timezone alignment for US West Coast teams, with Guadalajara specializing in enterprise and cloud engineering, Monterrey specializing in enterprise, industrial, and manufacturing technology, a large and established IT talent pool, and USMCA protections on IP and trade secrets that track closer to US standards than most offshore alternatives. Brazil holds one of the largest developer talent pools in the region, though the CLT employer burden runs qualitatively higher than in Argentina or Colombia and needs to be modeled explicitly rather than assumed away; São Paulo is the country's primary tech hub and home to a concentration of senior engineering talent. Colombia is one of the fastest-growing tech ecosystems in the region, with a rapidly growing base of software engineers and a strong regional startup ecosystem ranking, and Bogotá anchors the country's technology sector. Chile offers the most institutionally stable tech market in the region, with a smaller but highly specialized developer community in blockchain, C/C++, QA automation, and data science, though the 2025 pension reform adding up to 8.5% in employer contributions changes the cost calculus relative to prior years.
Specialization moves the number too. Cloud architecture, DevOps, AI/ML, and cybersecurity roles command meaningfully more than generalist full-stack positions across every LATAM market, so a defensible benchmark has to factor in specialization, not just seniority. English proficiency carries its own premium, since engineers with strong English skills access the best international opportunities and get compensated accordingly, which matters most for roles requiring client-facing or cross-functional communication. Howdy's verified 2025 payroll dataset and 2026 projections put average LATAM engineer salary growth at 3 to 7% for 2026, driven by demand in AI, data, and DevOps. Data engineering offers a useful cross-check: per hirewithnear.com, LatAm data engineer salaries range from $42,000 to $54,000 for junior roles up to $84,000 to $120,000 for management positions, with companies saving 50 to 70% versus US salaries while still running real-time collaboration.
The total cost of ownership model: what to include beyond salary and rate
Total cost of ownership is the only unit that makes a comparison fair, because it accounts for every expense across the engagement or the software's lifecycle, not just what shows up on a payroll report or an invoice.
On the US side, that means base salary adjusted for role and stage, the 29.9% benefits burden from BLS ECEC data, payroll taxes and legally required contributions, recruiting cost (that $5,475 SHRM average, higher for senior and executive searches), equity grants where they're material, equipment and tooling and workspace, management and interview overhead from senior staff, the deferred-output cost of a 30-to-90-day ramp period, and the vacancy cost of a senior seat sitting open while work goes unshipped.
On the nearshore side, the list runs parallel but not identical: base compensation adjusted for role, seniority, and country, statutory employer obligations like 13th-month pay, pension contributions, and severance mandates, EOR or agency fees carried as their own line rather than blended into the hourly rate, integration cost covering collaboration quality and timezone overlap, ramp and onboarding overhead (nearshore teams don't integrate for free), and a quality factor that accounts for rework or added specification time, because elevated rework quietly erodes whatever cost advantage the rate card promised.
Once rework, timezone overlap, and management overhead get priced into both sides, the practical cost gap between nearshore and US onshore hiring narrows compared to what raw rate cards imply. That's not a knock against nearshore hiring; it's a correction against the pitch that oversells it, just as the fully loaded US model corrects the pitch that undersells domestic cost. A defensible number is between those two distortions. The ROI framework from gocrossbridge.com (2026) lays out the sequence cleanly: it starts by defining the unit of value, which might be features shipped, cycle time, or revenue impact, then estimates fully loaded annual cost, applies an output multiplier built from ramp factor, collaboration factor, and quality factor, and finally compares cost per unit of output. The fully loaded cost per unit of output is the number that belongs in front of a board, not the raw rate on a staffing agency's homepage. Speed-to-value factors in as well: if nearshore hiring meaningfully shortens time-to-fill compared to US recruiting timelines, shipping a revenue-driving feature a full quarter earlier can outweigh whatever payroll savings the spreadsheet shows.
Data sources and their limits: how to choose inputs for a defensible benchmark
Compensation professionals benchmarking nearshore roles tend to draw from a consistent stack: the BLS Occupational Outlook Handbook, employer-reported data from Glassdoor, Levels.fyi, Hired, the Robert Half Technology Salary Guide, payroll-verified data from Pave covering more than 7,000 companies, and first-party EOR or staffing payroll datasets like Howdy's LATAM figures.
The sources checked for this guide are listed below.
Sources
- Data Engineer Salary Guide: US vs. Offshore Comparison
- The ROI of Nearshore Staffing: A Breakdown for Finance-Minded Founders
- Cost of Hiring a VP of Engineering (2026): Salary, Equity, and Total Investment
- 2026 Compensation Trends and Salary Guide - Blue Signal Search
- Nearshore Code Average Salary, Pay Ranges & Benefits | Salary.com
- Nearshore Staffing Agency Pricing (2026 Guide) | Kore BPO
- howdy.com
- howdy.com