Latin America Engineering Salary Benchmarks Versus North American Equivalents
Real payroll data reveals the actual cost gap between Latin American and North American engineers.
Most published LATAM salary guides pull from Glassdoor surveys, SalaryExpert estimates, or scraped job board listings. Those numbers describe local labor markets, not what US companies actually pay remote engineers, and the gap between the two is wide enough to blow up a hiring budget before the first offer letter goes out. The core figures here come from Howdy's internal payroll dataset, covering more than 12,500 software professionals across eight countries in Latin America under compliant employment agreements with US companies. These are real USD take-home numbers pulled from payroll records, not survey guesses or numbers scraped off a job board.
Two other sources round out the cost-stack detail: Mismo's LATAM hiring cost guide and South's LATAM salary benchmark, plus country-level statutory tax data. Each measures something different, and mixing them up is the single most common way a hiring budget goes wrong. Howdy tracks take-home USD pay for US-facing remote hires. Mismo tracks fully loaded employer cost: taxes, EOR fees, benefits, equipment, on top of salary. South tracks role-category ranges by seniority and country.
Some guides cite local market rates, like $28,000 to $30,000 for a developer in Mexico or $31,000 to $35,000 in Brazil. Those figures describe someone hired inside the domestic economy, paid in local terms, subject to local market pressure. They are not the number a US company should budget against when paying a remote engineer in USD, and treating the two as interchangeable is the mistake this piece is built to correct. Before trusting any benchmark, check whether it's quoting take-home or gross pay, a contractor rate or the fully loaded employer cost, and a local market rate or a US-facing remote rate. Get any one of those wrong and every number built on top of it is wrong too.
The headline cost gap between US and LATAM engineers
A fully loaded US software engineer costs $165,000 to $175,000 a year. A comparable engineer hired in LATAM costs roughly $65,000 to $72,000. That's a 60 to 65% cut in total employer cost, based on Howdy's data, and it's the real number, not the base-salary comparison most guides stop at.
The median US software developer earns $133,080 a year in base pay, before payroll taxes, benefits, and overhead push the fully loaded figure well past that. On the LATAM side, average take-home for US-facing remote roles runs $55,000 to $67,000 a year.
That 60 to 65% figure isn't fixed. It moves with seniority, country, role, and hiring model, and it only holds once ramp-up time, recruiting cost, EOR fees, payroll taxes, and attrition risk get folded in. Companies that quote the headline number without running those line items end up underestimating the true cost by a wide margin. On its own, this figure is also the least useful number in the piece, because it hides more than it shows. The country-level detail below explains why.
Country-by-country salary averages for US-facing remote engineering roles
Howdy's 2026 payroll data puts annual take-home USD averages at roughly $64,000 in Argentina, $63,000 in Uruguay, $62,000 in Chile, $62,000 in Peru, $57,000 in Mexico, $57,000 in Colombia, and $54,000 in Brazil.
Year-over-year growth has held around 2% across most of these markets. That flat number hides a real story: demand for senior and AI-capable engineers is pulling actual pay upward inside each country even while the national average barely moves.
Argentina, Uruguay, and Chile are at the top of the range for reasons that appear in the work itself: engineers there carry more production experience on distributed teams, English proficiency runs stronger (Argentina especially), and startup ecosystems in Buenos Aires, Montevideo, and Santiago have m Engineers there carry more production experience on distributed teams, English proficiency runs stronger (Argentina especially), and startup ecosystems in Buenos Aires, Montevideo, and Santiago have matured enough that engineers arrive already fluent in modern toolchains and agile workflows.
Mexico and Colombia post lower averages but stay the first call for most US hiring teams anyway. Timezone overlap with US business hours is close to ideal, and Mexico alone counts more than 500,000 developers, giving companies a deep bench for volume hiring. Both markets trade a bit of talent depth for a workable balance of cost, English fluency, and availability.
Brazil is one of the largest tech talent markets in the region, yet it posts the lowest average take-home in the dataset at roughly $54,000. That gap between talent supply and headline pay is what makes Brazil worth its own section later. Senior engineers working for foreign companies clear well above the country average there, and higher still under US-facing remote structures.
Country selection shifts the cost band, but only at the margins. Seniority moves the number more than geography does, and that argument carries the next section.
How seniority changes the cost equation
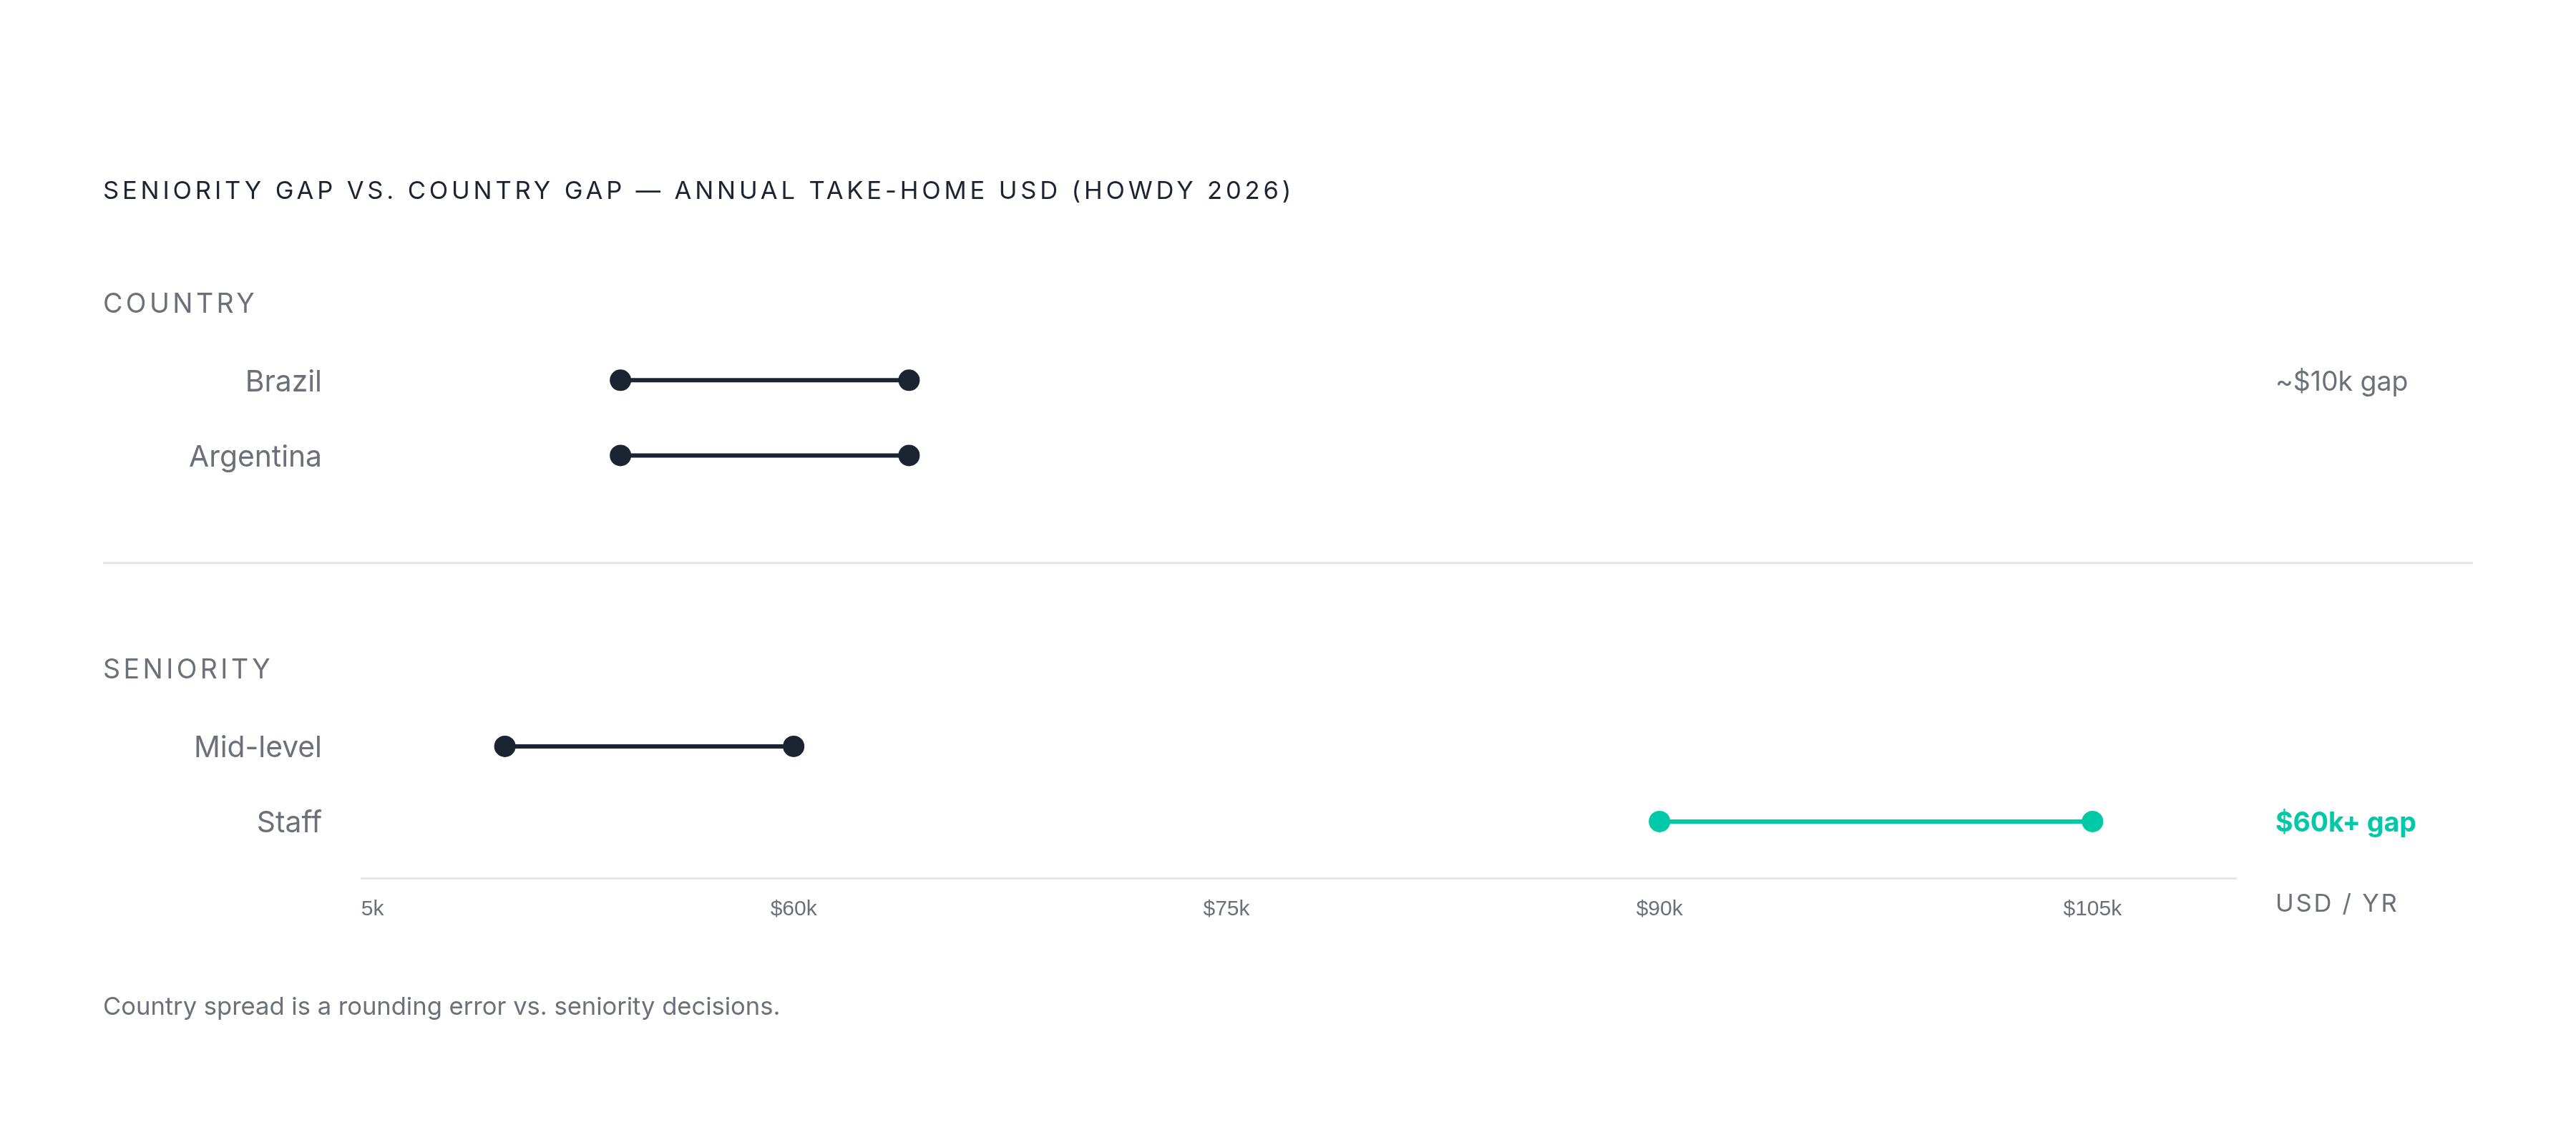
Howdy's verified 2026 seniority bands, in annual take-home USD: mid-level engineers fall between $50,000 and $60,000, senior between $65,000 and $75,000, principal between $80,000 and $95,000, staff between $90,000 and $105,000.
Setting that next to the country spread means the comparison stops being close. Junior to staff runs from $40,000 to $105,000, a gap topping $60,000. The gap between the cheapest and most expensive countries in the dataset, Brazil at $54,000 and Argentina at $64,000, is a rounding error next to that. A company that picks its country by the lowest average and then goes hiring for seniors will keep finding production-ready candidates priced well past whatever median it budgeted against. Seniority is doing most of the work here, not geography.
Mismo's 2026 guide backs this up from a different angle: LATAM base compensation ranges from about $1,800 a month for junior engineers to more than $11,400 a month for senior specialists, a ratio north of 6 to 1 across the seniority spectrum. Companies that optimize purely for the lowest salary tend to pay more anyway, through churn, weak project ownership, and repeated onboarding cycles. The real lever on the budget is seniority and role scope, not which country sits on the offer letter.
"Senior" itself isn't a stable label across LATAM markets. Years of experience gets used as the proxy, but the definition that actually predicts performance rests on impact, independence, and outcomes delivered without hand-holding. Misjudge that and the company pays for a bad hire twice: once for the hire, once for redoing it. Seniority also stacks with specialization, which the next section covers.
Role and specialization premiums: what AI, DevOps, and data engineering add to the base rate
Howdy's 2026 data shows AI, ML, cybersecurity, data engineering, and DevOps roles carrying premiums of 10 to 20% above standard seniority bands across the region, stacked on top of whatever the seniority level already sets as the floor.
South's 2026 benchmark splits US-facing LATAM remote roles into broad bands by category, with software development and engineering roles generally spanning a wide range, and data, AI, and analytics roles commanding comparable or higher ceilings.
AI-native and ML-capable engineers sit at the top of both ranges. Demand for engineers who can build machine learning workflows directly into production codebases is concentrated on a narrow pool, and that pool prices well above whatever the country average suggests.
LATAM salaries overall are set to rise 3 to 7% in 2026, concentrated in AI, data, and DevOps roles rather than spread evenly across the board. The 2% average growth Howdy records across most country totals understates what companies are actually paying for the specific profiles they need. Budget for seniority first, then add a specialization premium for AI, DevOps, or data roles on top. Treat the base figure as a floor for these profiles, not a ceiling.
From base salary to fully loaded cost: what hits the budget
Mismo lays out the full formula: LATAM hiring cost equals base compensation, plus hiring fees, plus payroll and EOR administrative fees, plus employer taxes, plus statutory benefits, plus equipment and tools, plus onboarding and ramp time, plus management overhead, plus retention and churn risk. Base salary is one line item out of nine, and it's usually the smallest source of surprise in the final number.
Mismo's 2026 guide puts fully loaded cost at 1.4 to 1.5 times gross salary once employer taxes, EOR fees, benefits, and equipment get added in. EOR fees alone vary by provider and country: Mismo quotes $400 to $600 per employee per month, other providers quote flat fees from $299 to $1,000-plus, and Howdy models them as 10 to 15% of gross salary.
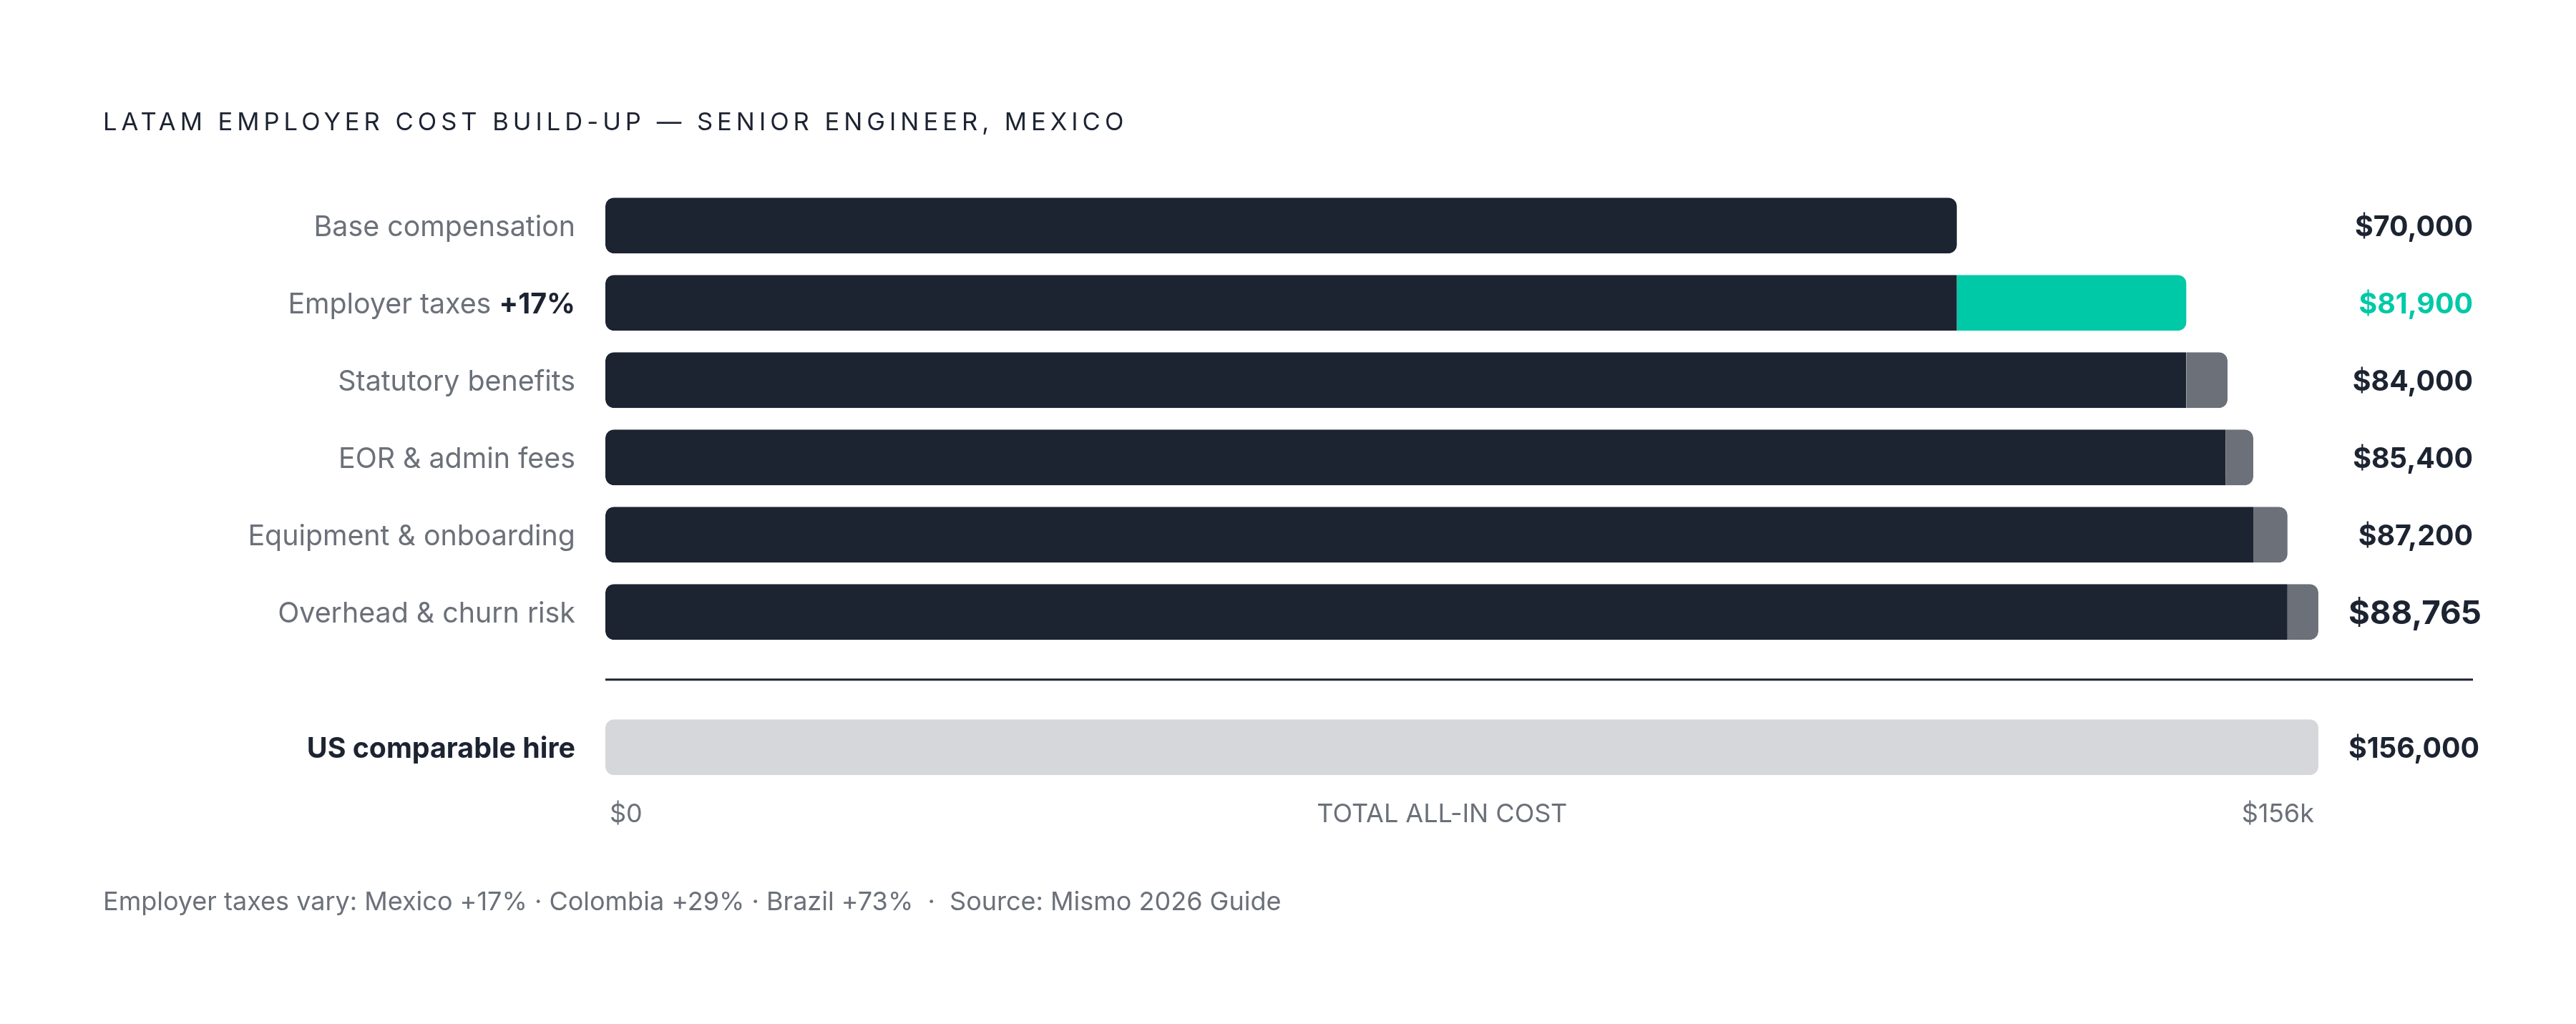
Employer payroll tax does the most damage to a naive base-salary comparison. Mexico adds roughly 17% over base. Colombia adds roughly 29%. Brazil runs payroll taxes at 73%, plus mandatory vacation bonuses, pushing total cost to nearly double base, the highest multiplier in the region. Chile adds only a small fraction above base.
A worked example from Howdy puts a senior engineer in Mexico at roughly $88,765 a year all-in, against roughly $156,000 for a comparable US hire, a 43% saving that survives every line item in the cost stack. For leadership roles the savings run higher still: HireSouth's 2026 benchmark guide puts senior software engineer savings at roughly 60% versus domestic US hires, with tech lead and leadership roles saving up to 78%. The 60 to 65% figure from the opening of this piece holds up, but only when both sides of the comparison use all-in cost rather than base salary. Comparing base salaries instead makes the number fiction.
Brazil's cost structure deserves its own explanation
Brazil supplies a large share of the region's developer talent, so talent supply is never the constraint. The $54,000 average take-home figure hides the actual constraint, which is what the money looks like after payroll tax.
Taken alone, that number makes Brazil look like the cheapest country on the board. It isn't, once the full cost stack applies, and the reason is Brazil's payroll tax structure.
Brazil's payroll tax burden runs 73%, and mandatory vacation bonuses stack on top, pushing the total cost multiplier to nearly double base salary. Chile's multiplier sits just above base. Mexico's and Colombia's land in a more moderate middle. Brazil stands alone as the market where the distance between headline salary and real employer cost runs widest in the region.
Local context sharpens the picture: domestic Brazilian engineer salaries run roughly $31,000 to $35,000, and senior engineers working for foreign companies clear well above that floor. The compliance risk compounds the cost risk here. Howdy points to a Brazilian court case that awarded a substantial sum in a contractor misclassification ruling, a result that turns EOR adoption in Brazil from a preference into something closer to a legal necessity. A company that picks Brazil because the take-home average looks lowest, without running the multiplier first, ends up with a total cost meaningfully above what the headline implied. No other market in the region punishes shortcut math this badly, and that's the specific lesson Brazil teaches: the cheapest-looking number on the chart is often the most expensive one on the invoice.
The salary trajectory: what is driving LATAM engineering compensation
LATAM engineering salaries grew 15 to 25% across 2024 and 2025, a sharp jump against prior years. The 2026 outlook calls for a more moderate 3 to 7% rise, still ahead of the roughly 2% year-over-year figure Howdy records across most country averages, but nowhere near the pace of the two years before it.
The gap between what the aggregate average shows and what specific roles actually cost keeps widening. AI, data, DevOps, and cybersecurity engineers are growing faster than the regional average, while generalist profiles are at the slower end. That divergence, not the headline growth rate, is the story that matters.
Howdy's 2026 analysis points to three forces holding the nearshore market steady even as wages climb. Supply keeps growing and specializing, with real depth building in AI, fintech, and cloud infrastructure roles. Currency has stabilized across Mexico, Brazil, Colombia, and Chile, trimming the currency-risk piece out of the hiring cost equation. And compliance pressure is pushing companies away from informal contractor arrangements toward EOR-mediated hiring, a shift that adds a fee line but cuts legal exposure substantially, the same exposure Brazil's court system has already put a price on.
Global demand for LATAM talent keeps intensifying on top of all this. One estimate puts 2026 rates for in-demand specializations 10 to 15% above 2025 levels. None of that erases the cost advantage this piece opened with. It does mean the advantage is a moving target that shrinks fastest for the roles companies want most, and it only holds up when the math accounts for seniority, specialization, and the full cost stack, not the headline country average sitting alone on a slide.
Sources
- The Real 2026 Cost of Hiring Software Engineers: US vs. Latin America (Based on Verified 2025 Data) | Howdy
- LATAM Hiring Costs: 2026 Benchmarks & Full Cost Guide
- 2026 Latin America Software Developer Salaries: Verified Data from Howdy | Howdy
- LatAm Hiring Cost Benchmarks 2026: All-In Rates, EOR Costs & Country Comparison | Howdy
- LatAm Engineering Rates 2026: Costs by Role and Country
- LATAM Software Engineer Salary Guide 2026: Averages & Costs
- 2026 LatAm Software Engineer Cost Benchmarks by Country | Howdy
- hiresouth.com